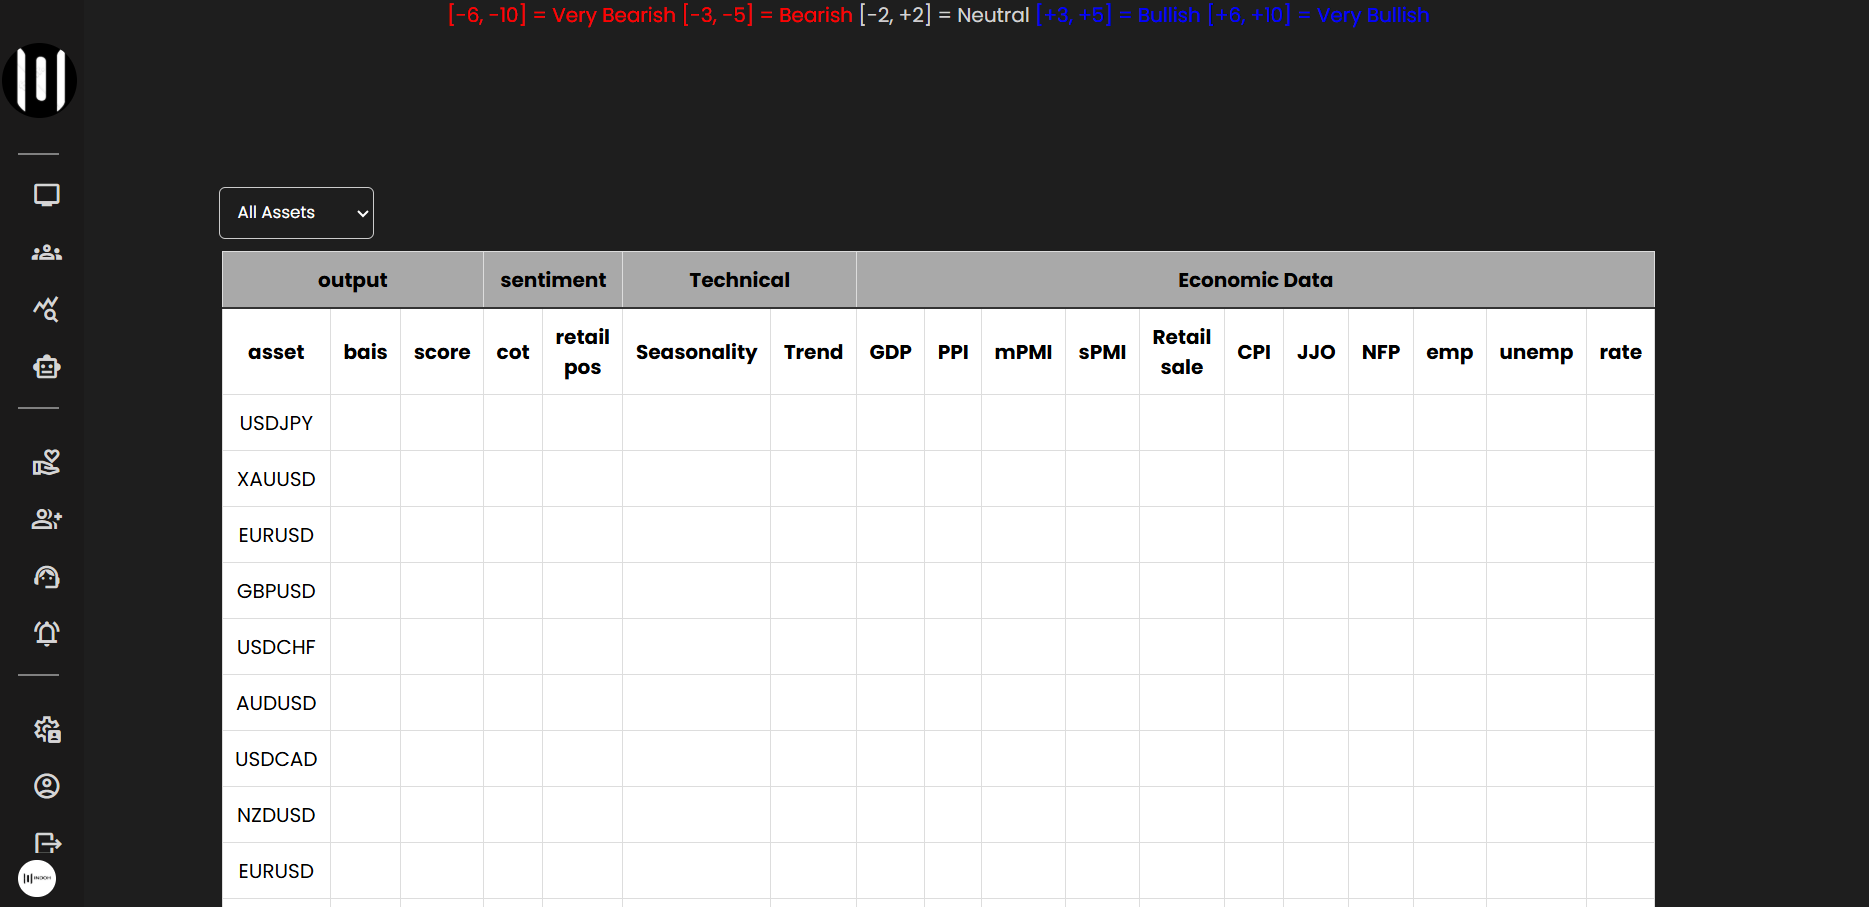
One dashboard for bias and score
Our home dashboard scores currencies, commodities, and indices using economic releases, seasonality, trend, COT positioning, and retail sentiment — then rolls them into a clear bias and output score.
Filter by asset class or bias direction and refresh live data so you can spot very bullish or very bearish conditions quickly.
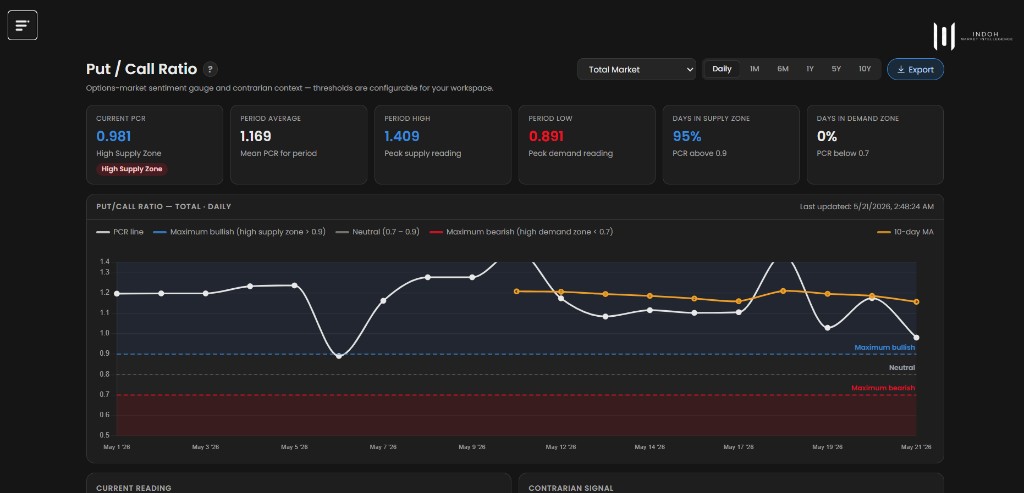
Put / Call Ratio
Options-market sentiment with configurable supply and demand zones, period averages, and contrarian context when PCR reaches extremes.
Track daily and multi-year readings to see when fear or greed is stretched — useful for confirmation and contrarian research.
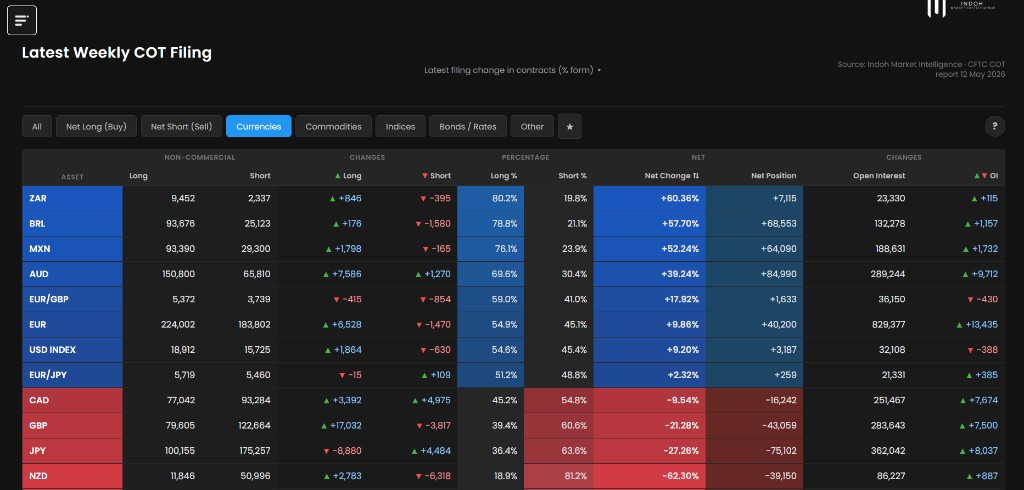
Commitment of Traders
Latest weekly COT filings with net long and short changes across currencies, commodities, indices, and rates.
Filter by asset class and compare non-commercial positioning percentages and open-interest shifts at a glance.
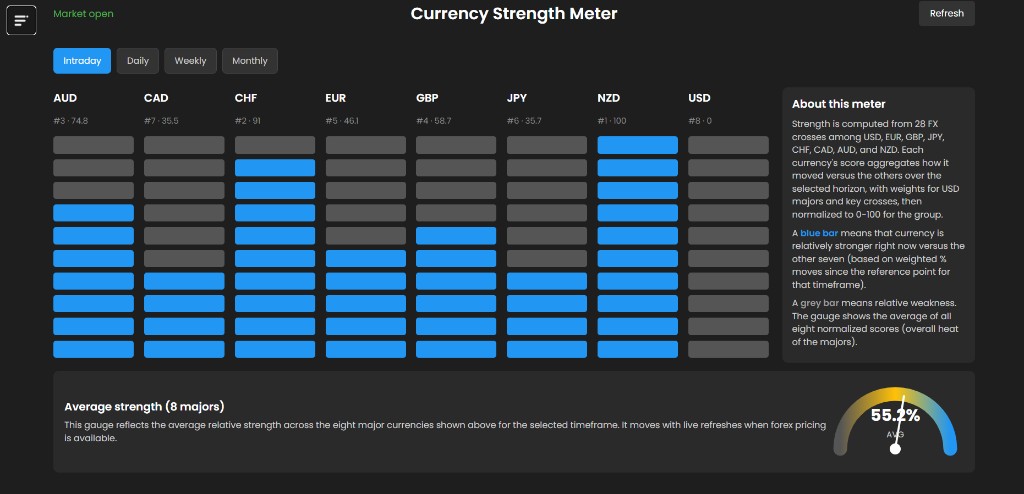
Currency Strength Meter
Relative strength for the eight major currencies from 28 FX crosses, normalized on a 0–100 scale for intraday, daily, weekly, or monthly views.
Read average strength across the group for quick macro context before diving into individual pairs.
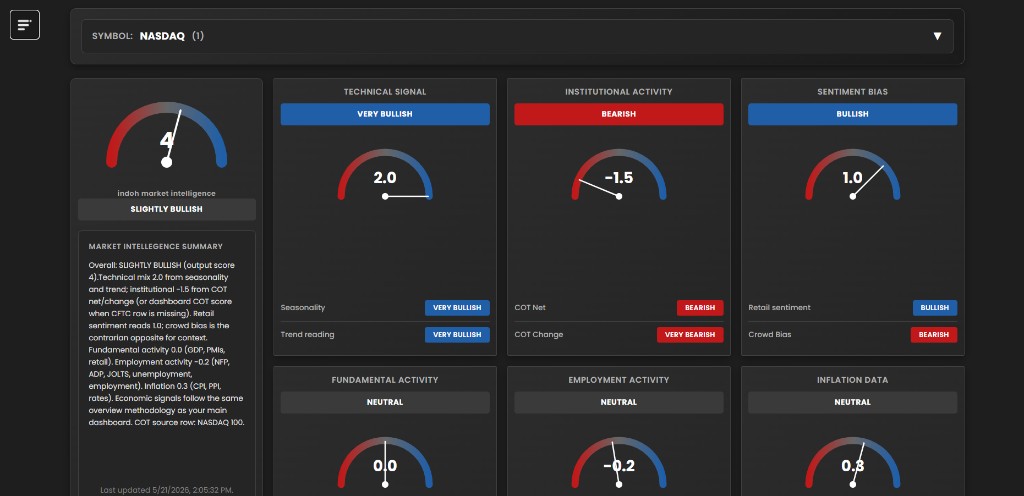
Deep Asset View
Symbol-level research combining technical, institutional, sentiment, fundamental, employment, and inflation scores into one output reading.
Each gauge breaks down seasonality, COT, retail sentiment, and macro activity for focused research on a single market.
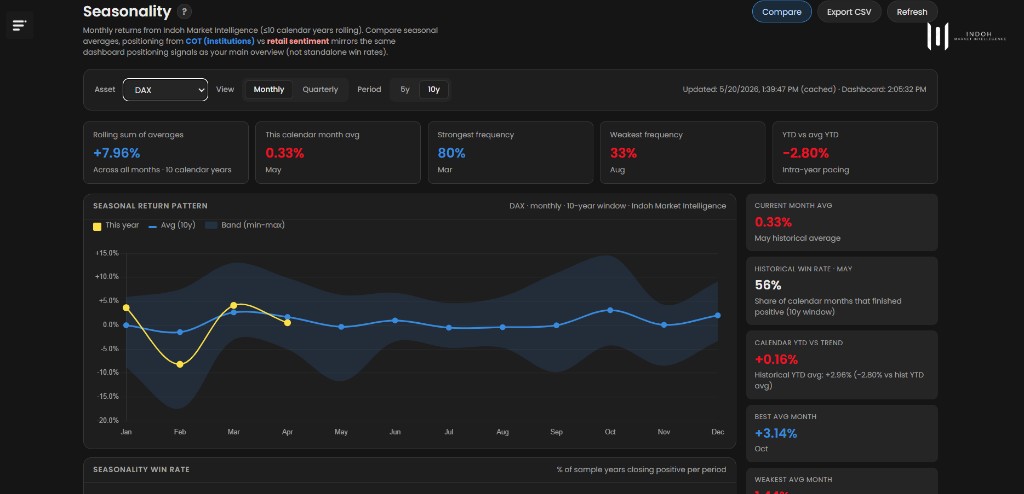
Seasonal return patterns
Monthly patterns from up to ten calendar years of history. Compare this year against the rolling average, min–max bands, and win-rate statistics.
Identify strongest and weakest months and calendar YTD pacing alongside your main dashboard signals.
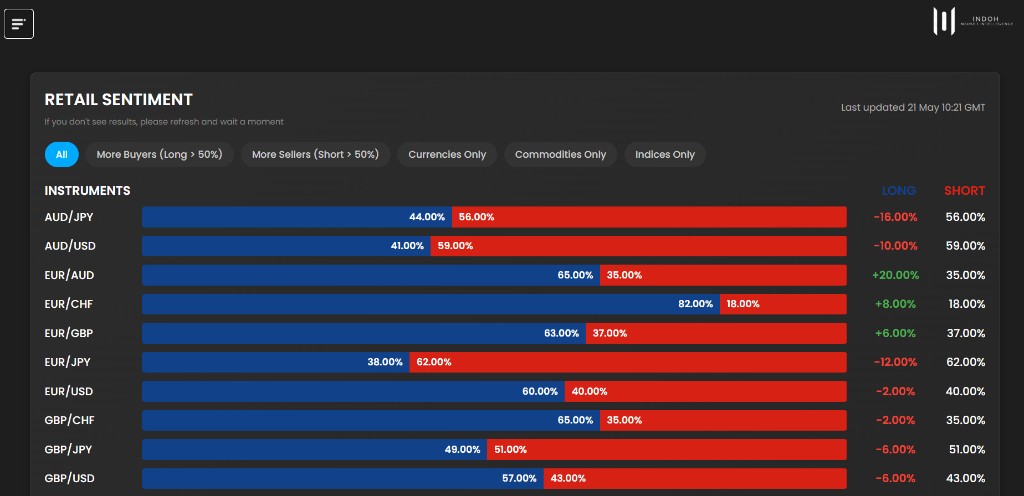
Retail Sentiment
Live long vs short positioning across major pairs and asset classes with filters for buyers, sellers, currencies, commodities, and indices.
Use crowd bias as contrarian context alongside technical and macro research — not as a standalone signal.
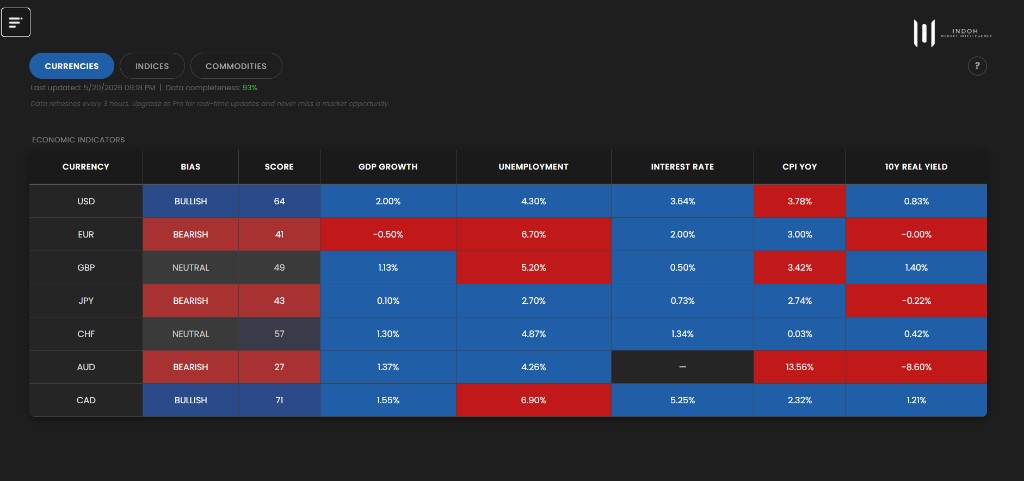
G7 Economic Indicators
Fundamental bias scores for major currencies using GDP growth, unemployment, interest rates, CPI, and real yields — updated on a rolling schedule.
Switch between currencies, indices, and commodities tabs to compare macro strength across asset classes.
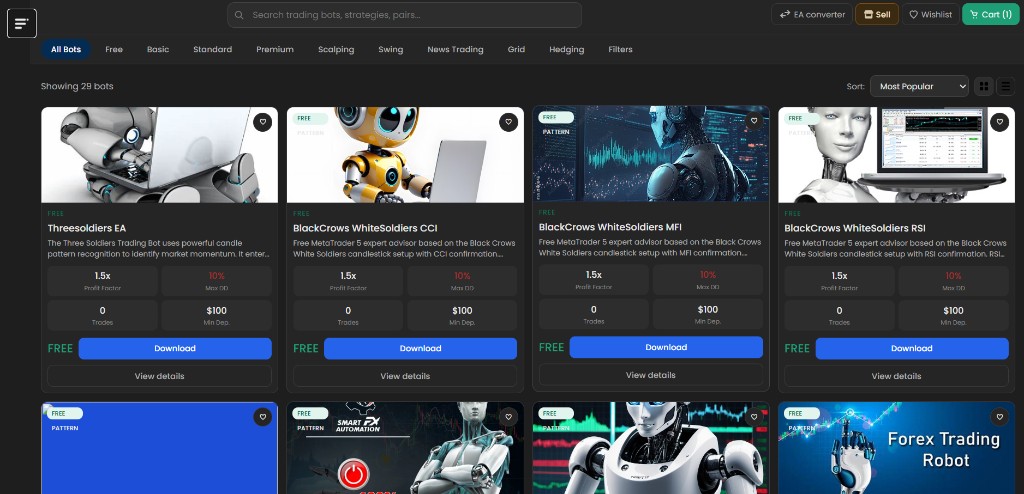
EA Marketplace
Browse automated strategies from approved sellers with filters for tier, style, and performance. Compare profit factor, drawdown, and minimum deposit on every listing.
Add bots to your cart or wishlist, download free experts instantly, or purchase paid strategies — then deploy with your own broker.
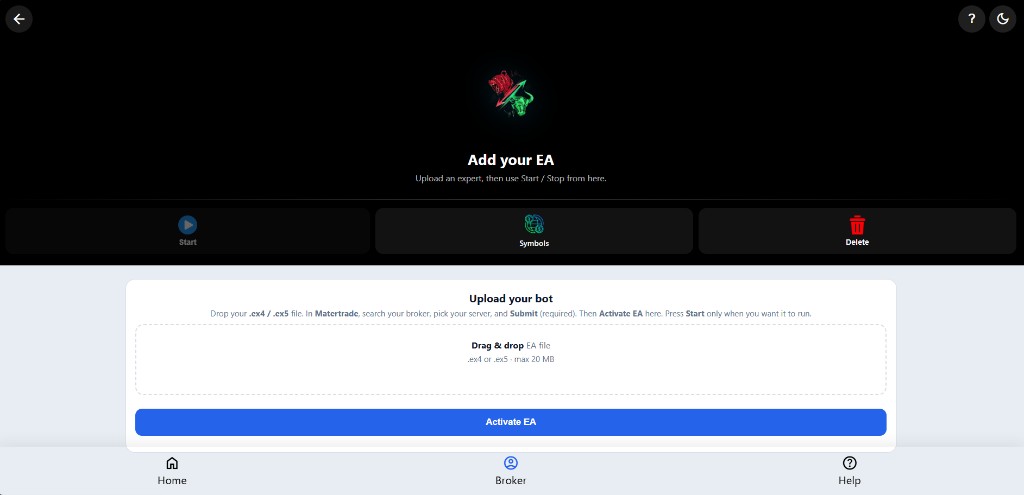
EA Converter
Upload your expert advisor file, select your broker and server, and activate it from a single workflow. Start and stop your bot when you choose — no manual file juggling.
Manage symbols and keep deployment steps organized so you can test strategies faster after download or purchase from the marketplace.